HR Diagrams for stellar evolution

Hertzsprung-Russell (HR) Diagram
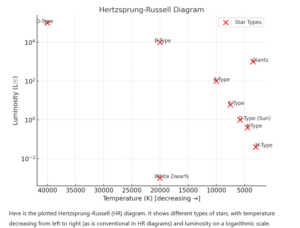
The Hertzsprung-Russell (HR) diagram is a key tool in astrophysics used to classify stars based on their luminosity, spectral type, color, temperature, and evolutionary stage. It provides insights into stellar evolution, from star formation to their end states as white dwarfs, neutron stars, or black holes.
Structure of the HR Diagram
- X-axis: Surface temperature of stars (in Kelvin), decreasing from left (hotter, blue stars) to right (cooler, red stars).
- Y-axis: Luminosity (relative to the Sun), increasing upwards.
Main Features
1. Main Sequence (Diagonal band from top left to bottom right)
Where stars spend most of their lives burning hydrogen.
Example: The Sun, a G-type main-sequence star (G2V).
2. Giants and Supergiants (Upper right)
Large, cool, but very luminous stars.
Example: Betelgeuse, a red supergiant.
3. White Dwarfs (Lower left)
Small, hot, but dim remnants of stars after they shed outer layers.
Example: Sirius B, a white dwarf companion to Sirius A.
Applications
- Understanding stellar evolution.
- Classifying stars based on their lifecycle stage.
- Predicting the fate of stars based on mass and temperature.